The good news is that pollution has declined by nearly 20% in both urban and rural areas between 2017 and 2022.
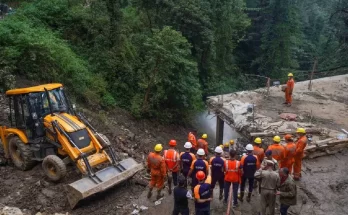
Representational image. (Credit: PTI)
New Delhi: “If you can’t measure it, you can’t manage it.”
What management guru Peter Drucker famously said a long time ago, sums up the air quality scenario in India today.
Exactly highlighting this adage, two sets of analyses released this week have brought in good news and bad news both – but mostly bad reflecting the abysmal state of air pollution in India.
First the bad news. Almost half of India’s population (47% to be precise) resides outside the air quality monitoring network and less than 200 cities monitor all six criteria pollutants, an analysis by Centre for Science and Environment (CSE) said on Thursday, July 6.
And now the good news. PM 2.5 levels have witnessed a similar trend of decline over both rural and urban areas between 2017 and 2022 with rural regions witnessing decline by 19% and urban by 18.7%, the analysis by Climate Trends using Satellite-based Application For Air Quality Monitoring and Management at National Scale (SAANS) developed by IIT Delhi’s Dr Sagnik Dey, released on Wednesday, July 5, said.
This is the scenario when there is a dedicated National Clean Air Programme (NCAP) for 131 cities across India and the Commission for Air Quality Monitoring in NCR and Adjoining areas (CAQM) for Delhi NCR. A robust air quality monitoring is the primary requirement for compliance under National Air Quality Standards (NAAQS) and NCAP.
The Ministry of Environment, Forest and Climate Change (MoEF&CC) had launched NCAP with much fanfare in January 2019 with a five-year target period and an overarching objective to reduce air pollution by 20-30% considering 2019 as baseline in the identified non-attainment cities. The Central Pollution Control Board (CPCB) has identified these 131 polluted cities that do not meet the prescribed National Ambient Air Quality Standards (NAAQS).
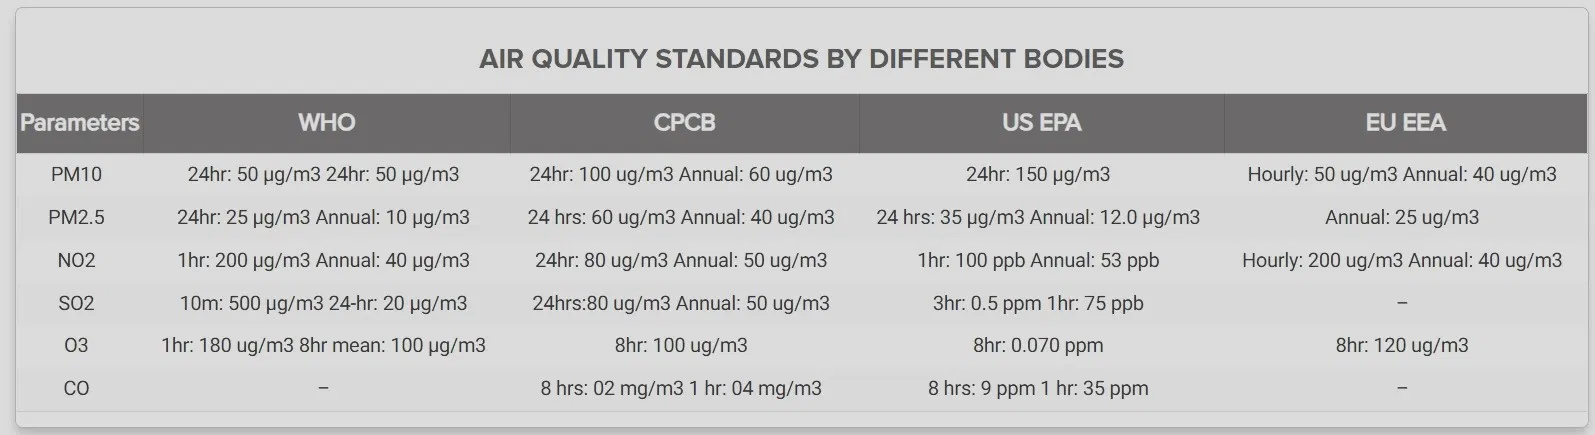
According to the Central Pollution Control Board’s National Ambient Air Quality Standards (NAAQS), the annual average safe limits for PM 2.5 are 40 ug/m3 and PM 10 are 60 ug/m3. This is well above the World Health Organization’s (WHO) revised guidelines of 5 ug/m3 and 15 ug/m3 for PM 2.5 and PM 10, respectively
But less than six months to go for the five year target period under NCAP, the data paints a bleak picture.
Lack of monitoring network
The CSE analysis released on Thursday has highlighted how the number of manual monitoring stations has doubled since 2010; number of real time monitoring stations has grown 20-fold since 2010, and yet, 47% of the population lives outside the 50-km radius coverage of combined manual and real time air quality monitoring network and less than 200 cities monitor all six criteria pollutants.
The other findings too are alarming. Less than half of the manual stations have PM2.5 monitors and only 51 stations meet the 104 days of minimum monitoring while over 70% of the real time stations meet minimum data completeness requirement but the rider is that CPCB has not specified any minimum requirement and the analysts used US standards for it.
But the inadequate monitoring grid is the most serious drawback.
Based on 2011 Census data, India has 4,041 statutory towns. As per the guidelines, these million-plus cities require 959 PM monitors, 643 SO2 monitors, 630 NO2 monitors and 320 monitors for CO and surface ozone each. “Cities with their population in the range of 100,000 and a million need 2,417 PM, 1,863 SO2 and 2,417 NO2 monitors and 525 monitors for CO and surface ozone, each. The requirement for small towns with a population less than 100,000 is staggering and adds up to 14,172 PM, 10,629 SO2, and 10,629 NO2 monitors, besides 3,543 monitors for CO and surface ozone, each,” the CSE analysis said.
“What is available is miniscule in comparison. India has only 1,187 PM10 monitors, 717 PM2.5 monitors, 1,161 SO2 monitors, 1,185 NO2 monitors, 406 CO monitors and 396 surface ozone monitors. A lot more will have to be added if the rural population is also considered,” it said.
Stating that the current urban monitoring grid is highly concentrated in few big cities and there are vast areas in other regions with no monitoring, and suggesting that this needs to be rationalised to cover a wider population and habitats, Avikal Somvanshi, senior programme manager, Urban Lab at the CSE, said: “The current monitoring network also faces the challenges of inadequate data generation, lack of data completeness and poor quality control of monitoring. This makes air quality trend assessment difficult to establish compliance with clean air targets.”
Pointing out another major lacuna, Anumita Roychowdhury, executive director, research and advocacy, CSE said, “More harmful PM2.5 and ozone are not considered for compliance under NCAP due to limited monitoring and data. It is necessary to ensure more equitable distribution of monitors and adoption of hybrid monitoring with a standardised and certified air sensor network and satellite-based monitoring with appropriate protocols for maximum and cost-effective coverage of population to support action.”
Some improvement in air quality between 2017 and 2022
The analysis by Climate Trends using Satellite-based Application For Air Quality Monitoring and Management at National Scale (SAANS) developed by IIT Delhi’s Dr Sagnik Dey addresses the gap in monitoring air pollution.
In fact, the analysis highlights the importance of satellite data in tracking the air pollution problem even when satellite data has some limitations as it is retrieved from aerosol optical depth and not the direct PM2.5. The 1km X 1km grid data set provides a holistic spread across the country, which the expensive ground-based monitoring network of stations does not cover.
The report ‘Status of Urban and Rural Air Quality Exposure at National Scale: A comparative analysis’ draws attention to the fact that “India’s air pollution mitigation action is highly concentrated in cities and often ignores the rural areas” even when air pollution continues to be a significant problem affecting both populations.
Apart from SAANS data, the Climate Trends’ analysis also used the Global Human Settlement Layer (GHSL) data for urban and rural classification for 1975, 1990, 2000, and 2015.
“Air pollution is a trans-boundary problem that knows no borders. There is an urgent need to track pollution levels and develop policies for rural regions, as there is little difference in concentration levels between urban and rural areas,” the analysis recommends.
The main findings of the analysis show that 10 states saw an upward trajectory in Urban and Rural regions since the pandemic in 2020 – Bihar, Goa, Gujarat, Kerala, Maharashtra, Telangana, West Bengal, Andaman and Nicobar, Chandigarh, and Dadra Nagar Haveli.
Between 2017 and 2022, 12 states saw the lowest PM2.5 levels in 2022: Arunachal Pradesh, Assam, Chhattisgarh, Jammu and Kashmir, Ladakh, Manipur, Meghalaya, Mizoram, Nagaland, Sikkim, Uttarakhand, and Uttar Pradesh.
“With a reduction of 37.8% and 38.1% in Urban and Rural PM 2.5 levels, respectively, Uttar Pradesh has recorded the best progress from 2017 to 2022,” it said, adding, “Maharashtra was the worst performing state, with only a dip of 7.7% in its Urban PM 2.5 levels, while with a decrease of 8.2% in its Rural PM 2.5 levels, Gujarat made the least progress.”
Across all regions, the rural areas saw a higher decline in PM 2.5 levels as compared to the urban levels. However, despite progress, only 14 and 12 states brought down their urban and rural PM 2.5 levels, respectively, under the CPCB safe limits of 40 ug/m3.
Sagnik Dey, Professor, Centre for Atmospheric Sciences, Indian Institute of Technology Delhi, said: “This analysis is a clear indication that India is inching towards plateauing its upward rising air pollution levels since 2016-2017. This is a positive achievement. However, the challenge now lies towards bringing the needle down further, especially as we are in the last year of the National Clean Air Programme’s targets of reducing 20-30% particulate matter levels by 2024.”
Way forward
Government’s own data under the NCAP shows that only 28.03% of the 131 cities have completed source apportionment and emission inventories studies; for 40.91% cities, work is under progress and for almost 1/3 rd (i.e. 31.06%) cities, the work has not even started and is at proposal or MoU level.
Not a single city has its ‘Action Plan’ approved while only 88.64% cities have developed their Graded Response Action Plans (GRAPs), the NCAP data further shows.
Summed up Aarti Khosla, Director, Climate Trends: “The study analyses air quality numbers at a national scale in the absence of any other way to look at air quality apart from ground key monitors. It is true that action is wanting and through this process we cannot ascertain which policies gave the result. But if we keep PM2.5 as an indicator of air pollution measure and calculate that through aerosol optical depth (AOD), then it does show that due to all reasons – weather, meteorological, wind direction, and emissions – there has been some plateauing of the pollution levels.”
“There is a long way to go if we check the level against any health benefits,” Khosla added.
(This story first appeared on news9live.com on Jul 07, 2023 and can be read here.)